Geospatial Resource Analysis
D&D Larix, LLC, provides a highly customized Geospatial Resource Analysis service. Our approach creates a well-designed product to imply our awareness of your professional needs. We fill the gaps by answering questions not even asked. Interpretation of GIS tools extend beyond creating a mere visual representation of data layers. It takes the shape of physical and digital maps, fortified by database records. Your knowledge is extended by professional expertise while extrapolating existing fixed parameters of today’s data. Temporal data projections are put into flexible patterns of its interpretation for future prognostication needs. D&D Larix, LLC, operates a full service GIS Analysis Center known as Geospatial Resource Analysis. Our services include a wide array products:
- custom map printing,
- feature analysis,
- multi-spectral image analysis,
- satellite imagery dissection,
- linear and non-linear multi-attribute regression analysis,
- Kriging,
- variography,
- geo-statistics determination,
- road network analytics,
- Shreve stream creation,
- and more!
Geospatial Resource Analysis completes vector and raster data analysis, commercial map printing and special map generation to suit your needs. In addition, we integrate GPS data (complete data dictionary management, post collection differential correction) into your GIS project. We then perform data evaluation to generate its visual, temporal, and spatial representations. Geospatial Resource Analysis offers you a Geographic Information Systems Laboratory capable of mapping data attributes. In addition, full analysis of a broad range of social, biological, and physical attributes, is released through our analytical service source.
We Analyze what others did not even know was a question
Digital Elevation Models (DEM) have been available since GIS was first applied to cartography and mapping centuries ago. The digital-age stepped into geospatial resources analysis along with the introduction of Personal Computers (PCs) in early-1990s. From that pivot point, data storage and rapid accessibility gave the new technological advancement. This created a super-charge giving value to information processing and storage of HUGE amounts of data.
“Raster is Faster, but Vector is more-correcter” became a slang used in spatial analysis groups. This gave analysis power to insinuating that raster data resides at the core of geospatial resource analysis. With 90-meter DEM raster resolution, analysts thought was faster to analyze than vector polygons, lines and points. By 2000, those original 90-meter DEM databases were replaced federally, with the USGS 30-meter DEM data. By 2005, 10-meter resolution DEM models of most of the USA were made available. Some areas have been assessed with Light Detection And Ranging (LiDAR) flights. Flights generally collect topographic information by fixed-wing aircraft (also airborne laser scanning). Imagery collects geo-positioned elevation points of the ground and tree height characteristics from the ground to tree tops.
These high definition 1-meter DEM arrays are 8,000 times more dense than their 90 meter predecessors. That density takes storage space and computational power to analyze. The data generated are truly powerful for the analyst to integrate into the cadre of natural resource attributes.
Data Integration Explains Data Meaning
Combining these DEM data with other data gives meaning to why these efforts are made. Watching the adjoining panel, the viewer will watch a series of analysis steps. These images convert the raw LiDAR field into a hillshade image. Refined to reveal heightened contrast, the normalized scene reveals an unsupervised road location. The algorithms applied reveal centerline and road width characteristics. Geospatial Resource Analysis has developed these techniques and written the code to reveal broad areas where road widths are discovered. Road center-lines are linked, and terrain conditions are investigated.
LiDAR DEM data are used to predict where stream networks are located, from mountain peak to ocean pour-point. The 1-meter DEM data provide high resolution to the central location of the channel. Further investigations reveal stream width at full-channel, stream migration zones, and flood plains. These data are combined with the LANDSAT 8 OLS multispectral satellite imagery scenes, soil type data, and vegetative associations. We discover more than ever thought possible.
This is what we do.
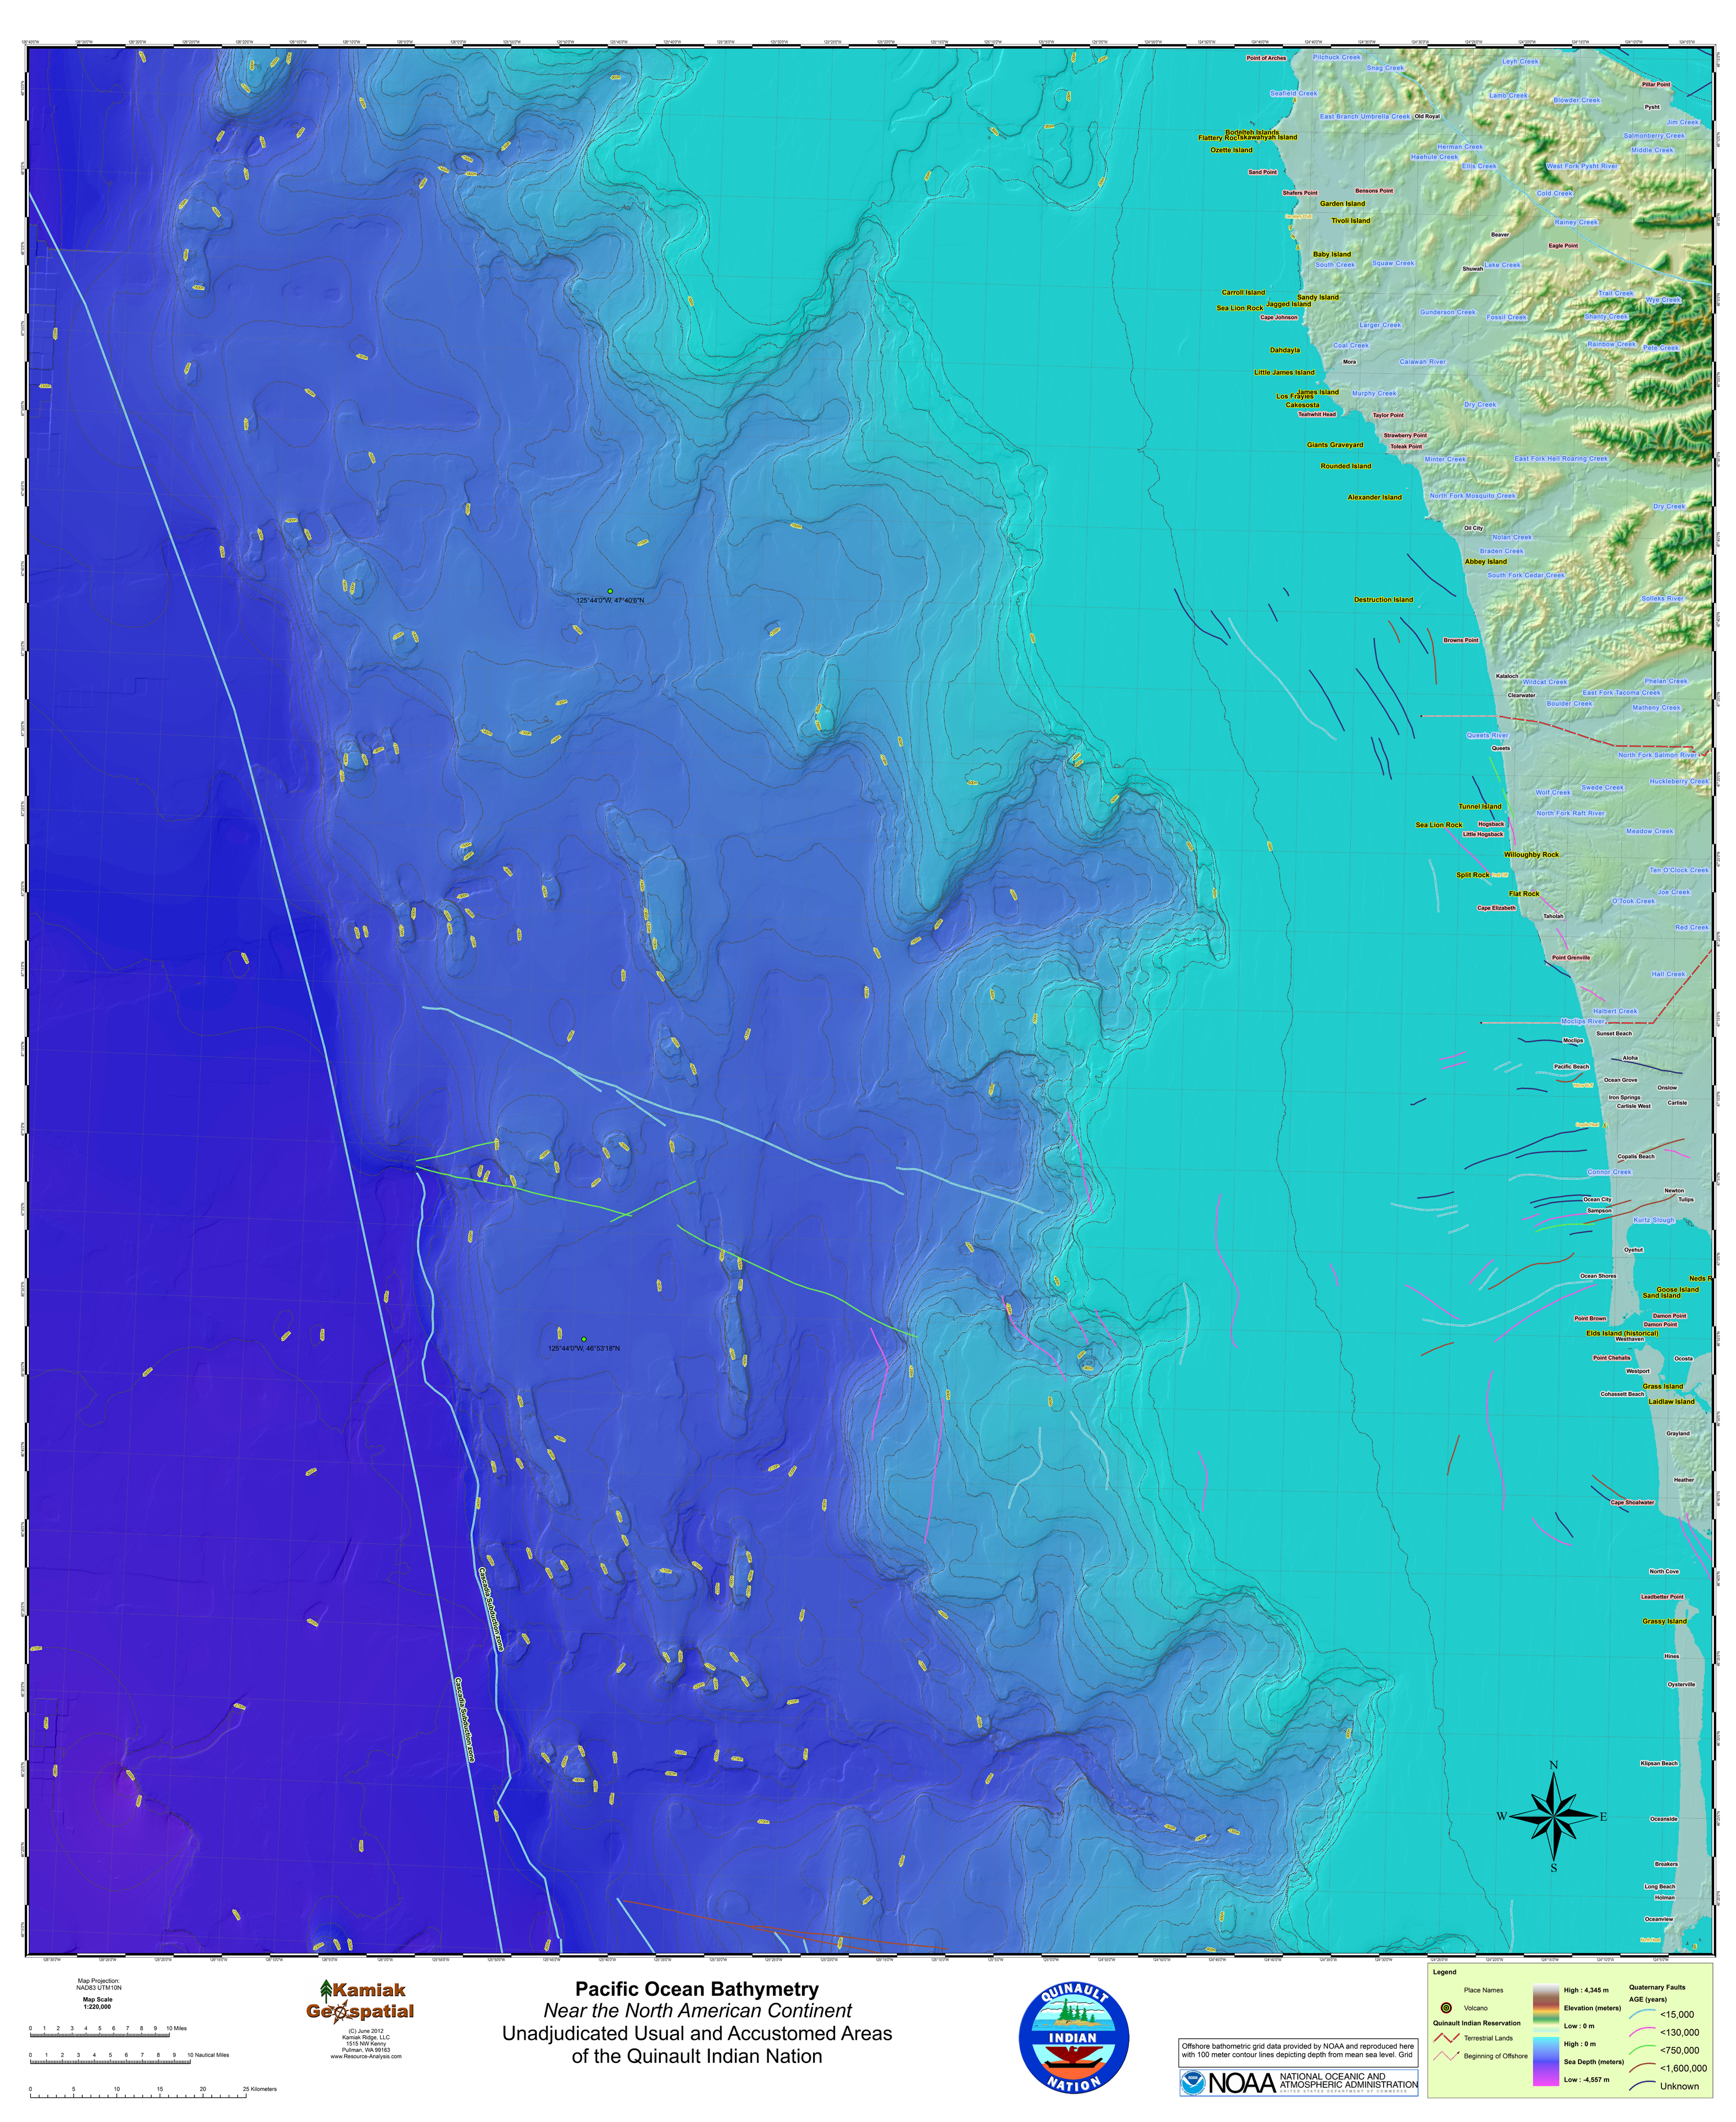
Custom Mapping
Custom mapping, in a sense, is a nonsensical phrase because all maps are a custom creation. The unique components we provide come in the form of seeking and locating unique features. These explain environmental interactions of the physical site characteristics being considered.
Download the Pacific Ocean Bathymetry Map with elevation contours and fault lines: Ocean Floor Bathmytery
Download the Quinault Indian Reservation Tsunami Hazard Risk Profile Poster: Public Outreach
Download the Benewah County, Idaho, Wildland-Urban Interface category map: Benewah County WUI