Natural & Human Caused Risks
Risks are Addressed by FEMA, and people who want to be Prepared
Natural resource hazard mitigation efforts begin by integrating physical site properties into a holistic geospatial analysis picture. Integration of how geology, soils, precipitation, aquatic systems, vegetation, and people have come together to influence how natural processes interact. This is the focus of mapping hazard prone areas. Sometimes, hazards are declared based on how people, structures, infrastructure, and natural environments are damaged by natural processes. Sometimes the hazard comes in terms of cascading events of one disaster that causes another disaster, and so forth.
Specialists have been mapping hazard prone areas for centuries to protect properties and people. The art and science was intensified after the 9/11/2001 terrorist attacks in the USA. The intensification of hazard mitigation attention is managed in the USA by the Federal Emergency Management Agency (FEMA). Hazard Mitigation Plans are prepared by jurisdictions to establish recognition of potential natural and man caused hazards. The mitigation plans include actions the jurisdiction can implement to reduce the negative impacts of the potential hazard.
People of D&D Larix have developed Hazard Mitigation Plans with Indian Tribes, States, Counties, and Cities since 2001. In each planning event, mapping hazard prone areas was an integral part of the assessment. As these data were developed for our client’s jurisdiction, we integrated the findings into the plan. The GIS data we developed were then provided to our client.
Hazard Mitigation has been practiced for centuries, but today’s analysis tools broaden our positive impacts.
Tsunami Inundation Zone
Tsunami deliver forceful wave patterns to ocean shoreline lands. These tsunami waves happen in near-shore earthquake events, or from distant tectonic events. Very often, the near-event incident causes the most destructive forces to ocean shoreline lands. This is what happened in the 2011 Tōhoku earthquake and tsunami in Japan. The magnitude 9.1 earthquake was centered only 70 km (43 mi) east of the Japan island. Waves over 40 m (133 ft) high crested on shore within 30 minutes of the initial earthquake.
The image accompanying this discussion, shows an anticipated tsunami inundation at Queets, Washington. Queets is located in the Quinault Indian Reservation along the Pacific Ocean shorelines in Washington State. This inundation zone is magnified by a the Queets River, draining alongside the settlement and into the Pacific Ocean. When a tsunami strikes this shoreline, the water force from the ocean will meet the water from the river. This will cause significant water backup, especially in the areas east and south of the last river meander. It is anticipated this backup will continue long after ocean waters are forced back into the sea. Logs, tree butts, and boulders will most likely accumulate within the meanders and cause river damming. Bridges and road networks will be compromised. Human habitation at the community of Queets is at risk.
The entire watershed is within a temporate rain-forest ecosystem, supporting salmon species, birds, and mammals. The tsunami event is expected to destroy the US Highway 101 bridge at Queets, and flood the community. Upstream of Queets another bridge crosses the river. We predict that bridge will also be compromised by the combination of tsunmai and Queets River water backup. Detritus dislodged by the river water backup and force of the tsunami waters will make rapid responses critical.
Tsunami Innundation Zones, Queets, Washington

Wildfire Risks: Fire Prone Landscapes
Fire Prone Landscapes of Mullan, Idaho

Analysis tools to assess the risk exposure to wildland fires are numerous. Each analysis tool has specific applications to unique needs and can be considered in light of the site being addressed; none of them will replace professional expertise of fire behavior analysts on the ground.
Schlosser et al. (2002), developed a methodology to assess the location of fire prone landscapes on forested and non-forested ecosystems in the western US. This assessment technique has been completed for tribal- and county-level fire mitigation plans and FEMA hazard mitigation plans, for Bureau of Indian Affairs and Bureau of Land Management Fire Management Plans and Environmental Assessments on over 60 project areas in Idaho, Alaska, Montana, Nevada, Oregon, Wyoming and Washington to determine fire prone landscape characteristics.
The goal of developing the Fire Prone Landscapes (FPL) analysis is to make inferences about relative risk factors across large geographical regions for wildfire spread. This analysis uses the extent and occurrence of past fires as an indicator of characteristics for a specific area and its propensity to burn in the future. Concisely, if a certain combination of vegetation cover type, canopy closure, aspect, slope, and position on the hillside, have burned with a high frequency in the past, then it is reasonable to extrapolate that they will have the same tendency in the future, unless mitigation activities are conducted to reduce this potential.
The basis of the analysis technique is to bring all of these factors together in a geospatial model (GIS layers) to determine the area of each combination of input variables that is available to burn, and then determine how much of this area actually burned in past fire events.
Flood Risks


Flooding and storm water accumulation is widespread along the edges of rivers and lakes. Flooding impacts areas where water accumulates on the surface and reaches a structure, road surface, or sensitive vegetative area. Flooding is a natural process that occurs when water leaves river channels, lakes, ponds, and other water bodies. It is also a serious and costly natural hazard when it occurs around buildings and infrastructure. Floods damage roads, farmlands, and structures, often disrupting lives and businesses. Flood-related disasters occur when property and lives are impacted by the flooding water. An understanding of the role of weather, runoff, landscape, and human developments in the floodplain is needed. It is therefore key to understanding and controlling flood-related disasters.
In many populated places in the USA, FEMA has mapped 100-year and 500-year flood zones. These serve the effort to create flood risk areas and to provide a means of risk assessment for homeowners. People want to know who is located in or adjacent to flood zones. Not all areas of the country have been mapped for FEMA Flood zone maps. These are produced in maps known as Flood Insurance Rate Maps (FIRM).
When FEMA FIRM data are available, we use them. In some areas these maps have not been created. Absence of flood maps by FEMA does not mean those areas are free from flooding. Nope, many times it is the opposite.
Geospatial data are available to make these flood zone estimates. Today, Digital Elevation Models (DEM) are flown using LiDAR technology to record topographic data to a 1-meter resolution. It takes well designed computer infrastructure and analyst acumen to convert these data. Topographic, soils, geology, precipitation, vegetation, and anthropogenic alteration are filtered into predictions of where floods are likely to happen.
We have created these flood zones for clients such as rural counties in Idaho, Montana, Wyoming, Neveda, and Washington. We have made flood zone predictions for tribal governments, where FEMA has not completed risk assessments such as flood. This provides people the ability to protect people, businesses, structures, infrastructure and the way of life known to the region.
Landslides & Mass Wasting: Landslide Prone Landscapes
Sturzstrom
A sturzstrom is a rare, poorly understood type of landslide, typically with a long run-out. Often very large, these slides are unusually mobile, flowing far over a low angle, flat, or even slightly uphill terrain. They are suspected of “riding” on a blanket of pressurized air, thus reducing friction with the underlying surface. These possibilities are revealed by mapping hazard prone areas.
Shallow landslide
A shallow landslide is common where the sliding surface is located within the soil mantle or on weathered bedrock. Typically, they are to a depth from a few feet to many yards. They usually include debris slides, debris flow, and failures of road-cut slopes. Landslides occurring as single large blocks of rock moving slowly down slope are sometimes called block glides.
Shallow landslides happen on slopes with highly permeable soils on top of low-permeability bottom soils or hardpan. Low-permeability bottom soils trap the water in shallower, highly permeable soils, creating high water pressure in the top soils. As top soils fill with water and become heavy, slopes can become very unstable. Soil material will slide over the low permeability bottom soils. During an intense rainstorm, the bedrock will keep the rain trapped in the top soils of silt and sand. As the topsoil becomes saturated and heavy, it can start to slide over the bedrock and become a shallow landslide.
Landslide Prone Landscapes and Faults, Wardner, Idaho

Deep-seated landslide
In deep-seated landslides, the sliding surface is mostly deeply located below the maximum rooting depth of trees. This situation typically happens at depths greater than 30 feet (10 m). Deep-seated landslides usually involve deep regolith, weathered rock, and/or bedrock. They include large scale slope failures associated with translational, rotational, or complex movements.
Landslide Prone Landscapes
Land materials may move by falling, toppling, sliding, spreading, or flowing. Some landslides are rapid, occurring in seconds, whereas others may take hours, weeks, or even longer to develop. Although landslides usually occur on steep slopes, they also can occur in areas of low relief. Landslides can occur as ground failure of river bluffs, cut-and-fill failures that may accompany road construction and building. They are frequently associated with excavations, mine-waste piles, and slope failures associated with quarries and open-pit mines.
The primary factors that increase landslide risk are slope and certain soil characteristics. In general, the potential for landslide occurrence intensifies as slope increases on all soil types. They happen across a wide range of geological formations.
From the Landslide Prone Landscape profile produced, it is possible to depict areas of risk. These are often associated through their proximity to development and human activity. With additional field reconnaissance, the areas of high risk are further defined by overlaying additional data points.
A risk-rating score of zero represents no relative risk and a score of one hundred is considered extreme risk. In practice, very few areas of the highest risk category (100) are found. This rating scale is considered as nominal data, producing values that can be ordered sequentially, but they are not multiplicative. This means that a site ranking 20 on this scale is not “twice as risky” as a site ranking 10. The scale provides relative comparisons between sites.
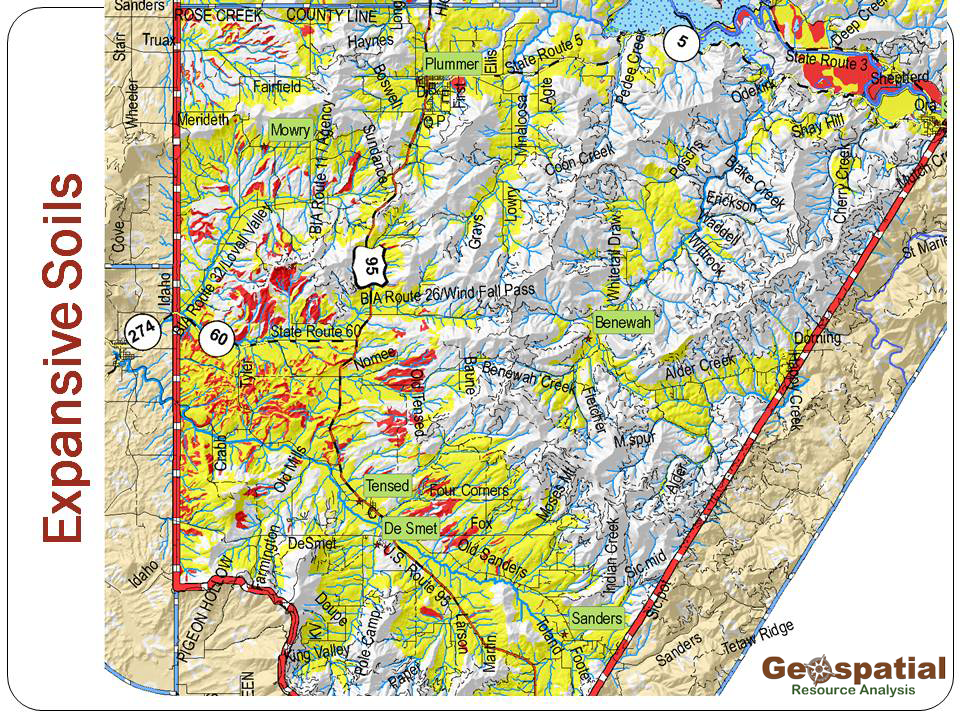
Expansive Soil Risks
Expansive soils and expansive clays are substrates that are subject to large-scale settlement or expansion when wetted or dried. Expansive soils contain minerals such as smectite clays that are capable of absorbing water. When these soils absorb water they increase volume. The more water these soils absorb the more their volume increases. Expansions of ten percent or more are not uncommon. This volume change can exert enough force on a structure resting on top of them to cause damage.
Expansive soils such as clay, claystone, and shale can “swell” in volume when wetted and then shrink when dried. This expansion and contraction can cause structures to heave, settle, and shift unevenly, resulting in damage that is sometimes severe. Cracks in building foundations, along floors and within basement walls are typical types of damage done by these swelling soils. Damage to the upper floors of the building can occur when motion in the structure is significant.
Expansive soils will also shrink when they dry out. This shrinkage can remove support from buildings or other structures and result in damaging subsidence. Fissures in the soil caused from differential expansion and contraction can also develop. These fissures can facilitate the deep penetration of water when moist conditions or runoff occurs. This produces a cycle of shrinkage and swelling that places repetitive stress on structures.
Soil type characteristics and their location reveals potential risks when mapping hazard prone areas across the landscape.
Expansive Soils on the Coeur d’Alene Indian Reservation

Cracks and Shifts
When expansive soils are present they generally do not cause a problem if their water content remains constant. The situation where greatest damage occurs is when there are significant or repeated moisture content changes. This condition can be found where rain gutters spill onto the ground at the edge of the foundation. Rainfall concentrated like this wets the soil during rainfall periods, leading to soil swelling. When these soils dry in the summer, the soils shrink. The home shown on the adjacent photo has already experienced the detrimental effects of the swelling (wet periods) and shrinking (dry periods). Damage is seen by the vertical foundation crack.
This is one of the effects of expansive soils, revealed through geospatial analysis of soils, slope, human habitation and observation. It happened with a home in this example. Consider if it happens to a bridge support, a water main supplying drinking water to a community. It might be the supports of an electrical distribution infrastructure. Mitigation measures are warranted.
It is surprising to realize that in the Hazard Mitigation Planning infrastructure administered by FEMA, this hazard is not included. Jurisdictions conduct their own risk vulnerabilities. If not comprehensibly conducted, the risk analysis would miss the expansive soils exposure. Because of this, our approach to mapping hazard prone areas is extensive and valuable.
Hazard Mitigation Must be Integrated with Public Outreach & Involvement
Benewah County, Idaho, located in the panhandle region of the state, is home of the Coeur d’Alene Indian Tribe’s Reservation. Benewah County has been attentive to hazard mitigation activities as “the Big Burn” incinerated much of this region in 1910. This wildfire ignited in nearby Wallace, Idaho, and burned about three million acres (4,700 sq mi; 12,100 km2). It spread across in northeast Washington, northern Idaho, and western Montana. Wildfire mitigation is understood by residents of this county. Residents know that true mitigation can only be realized with homes, infrastructure, and businesses all coordinate their efforts.
One of the most powerful analytic strategies used in this region has been development of a Fire Prone Landscapes. This analysis, enabled through Geographical Information Systems (GIS) regresses slope, aspect, vegetation, riparian zone characteristics, and associated physical site characteristics. One result is a map where wildfire risks are the highest. These are the tools of mapping hazard prone areas and we enable the analyses, develop meaningful mitigation strategies. We assist people to make the difference in their survival of natural hazards.
The term Wildland-Urban Interface (WUI) was introduced to assist people to contextualize how wildfire risks combine with human habitation. WUI zones (upper map with polygon lines) are segregated into Intermix, Interface, Rural Lands, Wildlands, and Infrastructure zones. The analysis to realize this approach has been developed by Dr. Schlosser to map where structures are placed throughout regions. The juxtaposition of these structures is analyzed in GIS systems to create these polygons seen on the map shown above. It creates a meaningful analytic combination to see where people, structures, and infrastructure are co-located with wildfire risks. These are the areas where wildfire mitigation efforts are prioritized and implemented.
Click on this link to download the discussion and commentary of how to Define the WUI. This uses example applied through time in Benewah County and other areas in the western U.S.A.
Click the image to see how posters share the word about how to use geospatial analyses to map the WUI. Public involvement is a core part of mitigation planning and implementation.
